Market Outlook
November 14, 2017
Market Cues
Domestic Indices
Chg (%)
(Pts)
(Close)
Indian markets are likely to open flat tracking global indices and SGX Nifty.
BSE Sensex
(0.8)
(281)
33,034
Nifty
(0.9)
(97)
10,225
U.S. stocks closed marginally higher Monday after the Dow and the S&P 500 posted
their first weekly drops in two months last week. The recent weaknesses in indices
Mid Cap
(0.2)
(32)
16,531
are largely owing to worries about delays in much-anticipated corporate tax cuts out
Small Cap
(0.4)
(73)
17,571
of Washington. While GE skidded 7.2% after conglomerate plans to cut its dividend
Bankex
(0.5)
(141)
28,780
by half. The Dow DJIA rose 0.07% to close at 23,440 and the S&P 500 climbed
0.1% to finish at 2,584. The NASDAQ gained 0.1% to end at 6,758.
Global Indices
Chg (%)
(Pts)
(Close)
The U.K. indices finished slightly lower on Monday, though their drop was limited by
Dow Jones
0.1
17
23,440
the pounds fall, which came after reports that British Prime Minister Theresa may is
Nasdaq
0.1
7
6,758
facing pressure to resign. The FTSE 100 fell 0.2% to close at 7415.
FTSE
(0.2)
(18)
7,415
Nikkei
0.3
74
22,455
On domestic front, shares declined sharply in Monday, as global cues were mixed,
industrial output data reports sluggish number and earnings updates from the likes
Hang Seng
(0.0)
(8)
29,174
of Adani Ports, DLF, Idea Cellular, BPCL and Coal India weighing on markets.
Shanghai Com
(0.5)
(17)
3,431
Investors also awaited consumer and wholesale price inflation data this week for
clues to the trajectory of food inflation in the months ahead. The benchmark BSE
Advances / Declines
BSE
NSE
Sensex fell by 0.84% to end at 33,034, while the broader Nifty index dropped
Advances
1,074
646
0.94% to close at 10,225.
Declines
1,686
1,094
News Analysis
Unchanged
146
53
Result Preview: Sun Pharmaceuticals
Volumes (` Cr)
CPI inflation comes in higher than expected at 3.58%
BSE
4,375
Detailed analysis on Pg2
NSE
30,441
Investor’s Ready Reckoner
Key Domestic & Global Indicators
Net Inflows (` Cr)
Net
Mtd
Ytd
Stock Watch: Latest investment recommendations on 150+ stocks
FII
(28)
9,738
48,190
Refer Pg5 onwards
MFs
2,326
3,825
99,236
Top Picks
CMP
Target
Upside
Top Gainers
Price (`)
Chg (%)
Company
Sector
Rating
(`)
(`)
(%)
Jpassociat
21
16.4
Blue Star
Capital Goods
Buy
707
867
22.6
Balkrisind
2,046
6.5
Dewan Housing Finance
Financials
Accumulate
633
712
12.4
Asian Granito
Other
Buy
485
570
17.4
Justdial
533
6.5
Navkar Corporation
Other
Buy
188
265
41.0
Amarajabat
789
5.0
KEI Industries
Capital Goods Accumulate
329
380
15.6
Adanitrans
215
5.0
More Top Picks on Pg4
Key Upcoming Events
Top Losers
Price (`)
Chg (%)
Previous
Consensus
Date
Region
Event Description
Rcom
12
(13.5)
Reading
Expectations
Nov14
China
Industrial Production (YoY)
6.60
6.30
Marksans
42
(13.5)
Nov14
Euro Zone Euro-Zone GDP s.a. (QoQ)
0.60
0.60
Rtnpower
7
(7.4)
Nov14
UK
CPI (YoY)
3.00
3.10
Il&Fstrans
78
(7.0)
Nov14
Germany GDP nsa (YoY)
0.80
2.00
Ipcalab
544
(6.4)
Nov14
India
Monthly Wholesale Prices YoY%
2.60
3.01
As on November, 13 2017
More Events on Pg7
Market Outlook
November 14, 2017
News Analysis
Sun Pharmaceuticals (CMP: `527 / TP: `558 /Upside: 6%)
The company is expected to post a disappointing numbers. In rupee terms,
revenues are expected to came in at `7,118cr V/s `7,764cr in 2QFY2017, down
8.3% yoy, mainly driven by the dip in the USA business. On the operating front the
EBITDA margin, is expected to came in at 20.0% V/s 34.3% in 2QFY2017; a yoy
dip of 14400bps, mainly due to pricing pressure. Consequently, PAT is expected
come in at `752cr V/s `2,235cr expected, a de-growth of 66.4% yoy. We maintain
our accumulate rating on the stock.
Y/E
Sales OPM
PAT
EPS ROE P/E P/BV EV/EBITDA EV/Sales
March
(` cr)
(%)
(` cr)
(`)
(%)
(x)
(x)
(x)
(x)
FY2018E
28,466
20.8
5,101
21.3
13.0
24.8
3.2
19.6
4.1
FY2019E
31,826
22.4
5,949
24.8
15.2
21.3
2.8
15.8
3.5
CPI inflation comes in higher than expected at 3.58%
The CPI inflation, a measure of retail inflation, for the month of October 2017
came in at 3.58%, nearly 30 basis points higher than the September levels. Food
inflation went up sharply to 1.90% in October from 1.25% in September and was
the big trigger for the rise in overall inflation. Interestingly, urban inflation for
October is nearly 45 basis points higher than rural inflation; a reversal of the trend
of the last couple of years. While pulses continued to deflate at -23%, the big boost
to food inflation came from vegetables which turned sharply higher at 7.47% due
to substantial wastage and crop damage. Inflation in fruits and milk also remained
elevated.
While the rise in CPI inflation was largely due to the food inflation factor, higher
crude oil prices have also had a downstream effect. That brings us to the core
question of how will the RBI react to this inflation number when it meets for its
monetary policy review on December 06th. Firstly, the CPI inflation is still well
within the RBI comfort zone of 4%. Secondly, the GST Council has drastically cut
the GST rates on 75% of the items in the 28% GST bracket and that is likely to
have a subduing effect on retail inflation in the coming months. However, the RBI
rate decision may still predicate on the Fed trajectory.
Economic and Political News
Centre may look at PSU stake sale option to set fiscal math right
RBI questions dealings under liberalised remittance scheme on laundering
suspicion
Corporate News
IOL Chemicals and Pharma to invest `200cr for expanding manufacturing
capacity.
Havells India signs a pact with South Korea’s Hyundai Electric for supply of
low and medium voltage protection, and switching devices.
Market Outlook
November 14, 2017
Quarterly Bloomberg Brokers Consensus Estimate
Sun Pharma Ltd - Nov 14, 2017
Particulars ( ` cr)
2QFY18E
2QFY17
y-o-y (%)
1QFY18
q-o-q (%)
Sales
6803
8,250
(17.6)
6,208
9.6
EBIDTA
1374
3,167
(56.6)
1,455
(5.6)
%
20.2
38.4
2.3
PAT
800
2,471
(67.2)
(322)
-
Tata Global Ltd - Nov 14, 2017
Particulars ( ` cr)
2QFY18E
2QFY17
y-o-y (%)
1QFY18
q-o-q (%)
Sales
1668
1,625
2.7
1,704
(2.2)
EBIDTA
207
189
9.6
244
(15.2)
%
12.4
11.7
14.3
PAT
130
139
(6.5)
141
(7.9)
Cadila Healthcare Ltd - Nov 14, 2017
Particulars ( ` cr)
2QFY18E
2QFY17
y-o-y (%)
1QFY18
q-o-q (%)
Sales
2824
2,353
20.1
2,197
28.5
EBIDTA
760
516
47.3
277
174
%
26.9
21.9
12.6
PAT
484
337
43.6
138
250
Eicher Motors Ltd - Nov 14, 2017
Particulars ( ` cr)
2QFY18E
2QFY17
y-o-y (%)
1QFY18
q-o-q (%)
Sales
2208
1,754
25.9
2,000
10.4
EBIDTA
697
542
28.6
620
12.5
%
5.4
30.9
31.3
PAT
538
413
41.2
459
17.2
Gail Ltd - Nov 14, 2017
Particulars ( ` cr)
2QFY18E
2QFY17
y-o-y (%)
1QFY18
q-o-q (%)
Sales
12999
11,877
9.5
11,406
13.9
EBIDTA
1873
1,534
22.1
1,899
(1.3)
%
14.4
12.9
16.6
PAT
1104
924
19.5
1,025
7.7
Bank of Baroda - Nov 14, 2017
Particulars ( `cr)
2QFY18E
2QFY17
y-o-y (%)
1QFY18
q-o-q (%)
PAT
414
552
(25)
203
103
Market Outlook
November 14, 2017
Top Picks ★★★★★
Market Cap
CMP
Target
Upside
Company
Rationale
(` Cr)
(`)
(`)
(%)
Strong growth in domestic business due to its leade`hip
in acute therapeutic segment. Alkem expects to launch
Alkem Laboratories
23,809
1,991
2,125
6.7
more products in USA, which bodes for its international
business.
We expect the company would report strong profitability
Asian Granito
1,460
485
570
17.4
owing to better product mix, higher B2C sales and
amalgamation synergy.
Favorable outlook for the AC industry to augur well for
Cooling products business which is out pacing the
Blue Star
6,774
707
867
22.6
market growth. EMPPAC division's profitability to
improve once operating environment turns around.
With a focus on the low and medium income (LMI)
consumer segment, the company has increased its
Dewan Housing Finance
19,858
633
712
12.4
presence in tier-II & III cities where the growth
opportunity is immense.
Loan growth is likely to pick up after a sluggish FY17.
Lower credit cost will help in strong bottom-line growth.
Karur Vysya Bank
7,805
129
180
39.4
Increasing share of CASA will help in NIM
improvement.
High order book execution in EPC segment, rising B2C
KEI Industries
2,576
329
380
15.6
sales and higher exports to boost the revenues and
profitability
Expected to benefit from the lower capex requirement
Music Broadcast
2,193
384
434
12.9
and 15 year long radio broadcast licensing.
Massive capacity expansion along with rail advantage
Navkar Corporation
2,828
188
265
41.0
at ICD as well CFS augur well for the company
Strong brands and distribution network would boost
Siyaram Silk Mills
2,761
589
650
10.4
growth going ahead. Stock currently trades at an
inexpensive valuation.
Market leadership in Hindi news genre and no.
2
viewership ranking in English news genre, exit from the
TV Today Network
2,222
372
435
16.8
radio business, and anticipated growth in ad spends by
corporate to benefit the stock.
After GST, the company is expected to see higher
volumes along with improving product mix. The Gujarat
Maruti Suzuki
2,44,922
8,108
8,890
9.6
plant will also enable higher operating leverage which
will be margin accretive.
We expect loan book to grow at 24.3% over next two
GIC Housing
2,303
428
655
53.1
year; change in borrowing mix will help in NIM
improvement..
Source: Company, Angel Research
Market Outlook
November 14, 2017
Key Upcoming Events
Result Calendar
Date
Company
November 14, 2017
Tata Global, JK Tyre, CEAT, Jyoti Structures, Bank of Baroda, Reliance Capital, Corporation Bank, MOIL
November 15, 2017
Automotive Axle
Source: Bloomberg, Angel Research
Global economic events release calendar
Bloomberg Data
Date
Time
Country
Event Description
Unit
Period
Last Reported
Estimated
Nov 14, 2017
7:30 AMChina
Industrial Production (YoY)
% Change
Oct
6.60
6.30
3:30 PMEuro Zone Euro-Zone GDP s.a. (QoQ)
% Change
3Q P
0.60
0.60
3:00 PMUK
CPI (YoY)
% Change
Oct
3.00
3.10
12:30 PMGermany GDP nsa (YoY)
% Change
3Q P
0.80
2.00
12:00 PMIndia
Monthly Wholesale Prices YoY%
% Change
Oct
2.60
3.01
US
Producer Price Index (mom)
% Change
Oct
0.80
Nov 15, 2017
3:00 PMUK
Jobless claims change
% Change
Oct
1.70
7:00 PMUS
Consumer price index (mom)
% Change
Oct
0.50
0.10
Nov 16, 2017
7:00 PMUS
Initial Jobless claims
Thousands
Nov 11
239.00
234.50
3:30 PMEuro Zone Euro-Zone CPI (YoY)
%
Oct F
1.40
1.40
7:45 PMUS
Industrial Production
%
Oct
0.28
0.50
Nov 17, 2017
7:00 PMUS
Housing Starts
Thousands
Oct
1,127.00
1,190.00
7:00 PMUS
Building permits
Thousands
Oct
1,225.00
1,250.00
Nov 21, 2017
8:30 PMUS
Existing home sales
Million
Oct
5.39
5.41
Nov 22, 2017
8:30 PMEuro Zone Euro-Zone Consumer Confidence
Value
Nov A
(1.00)
Source: Bloomberg, Angel Research
Market Outlook
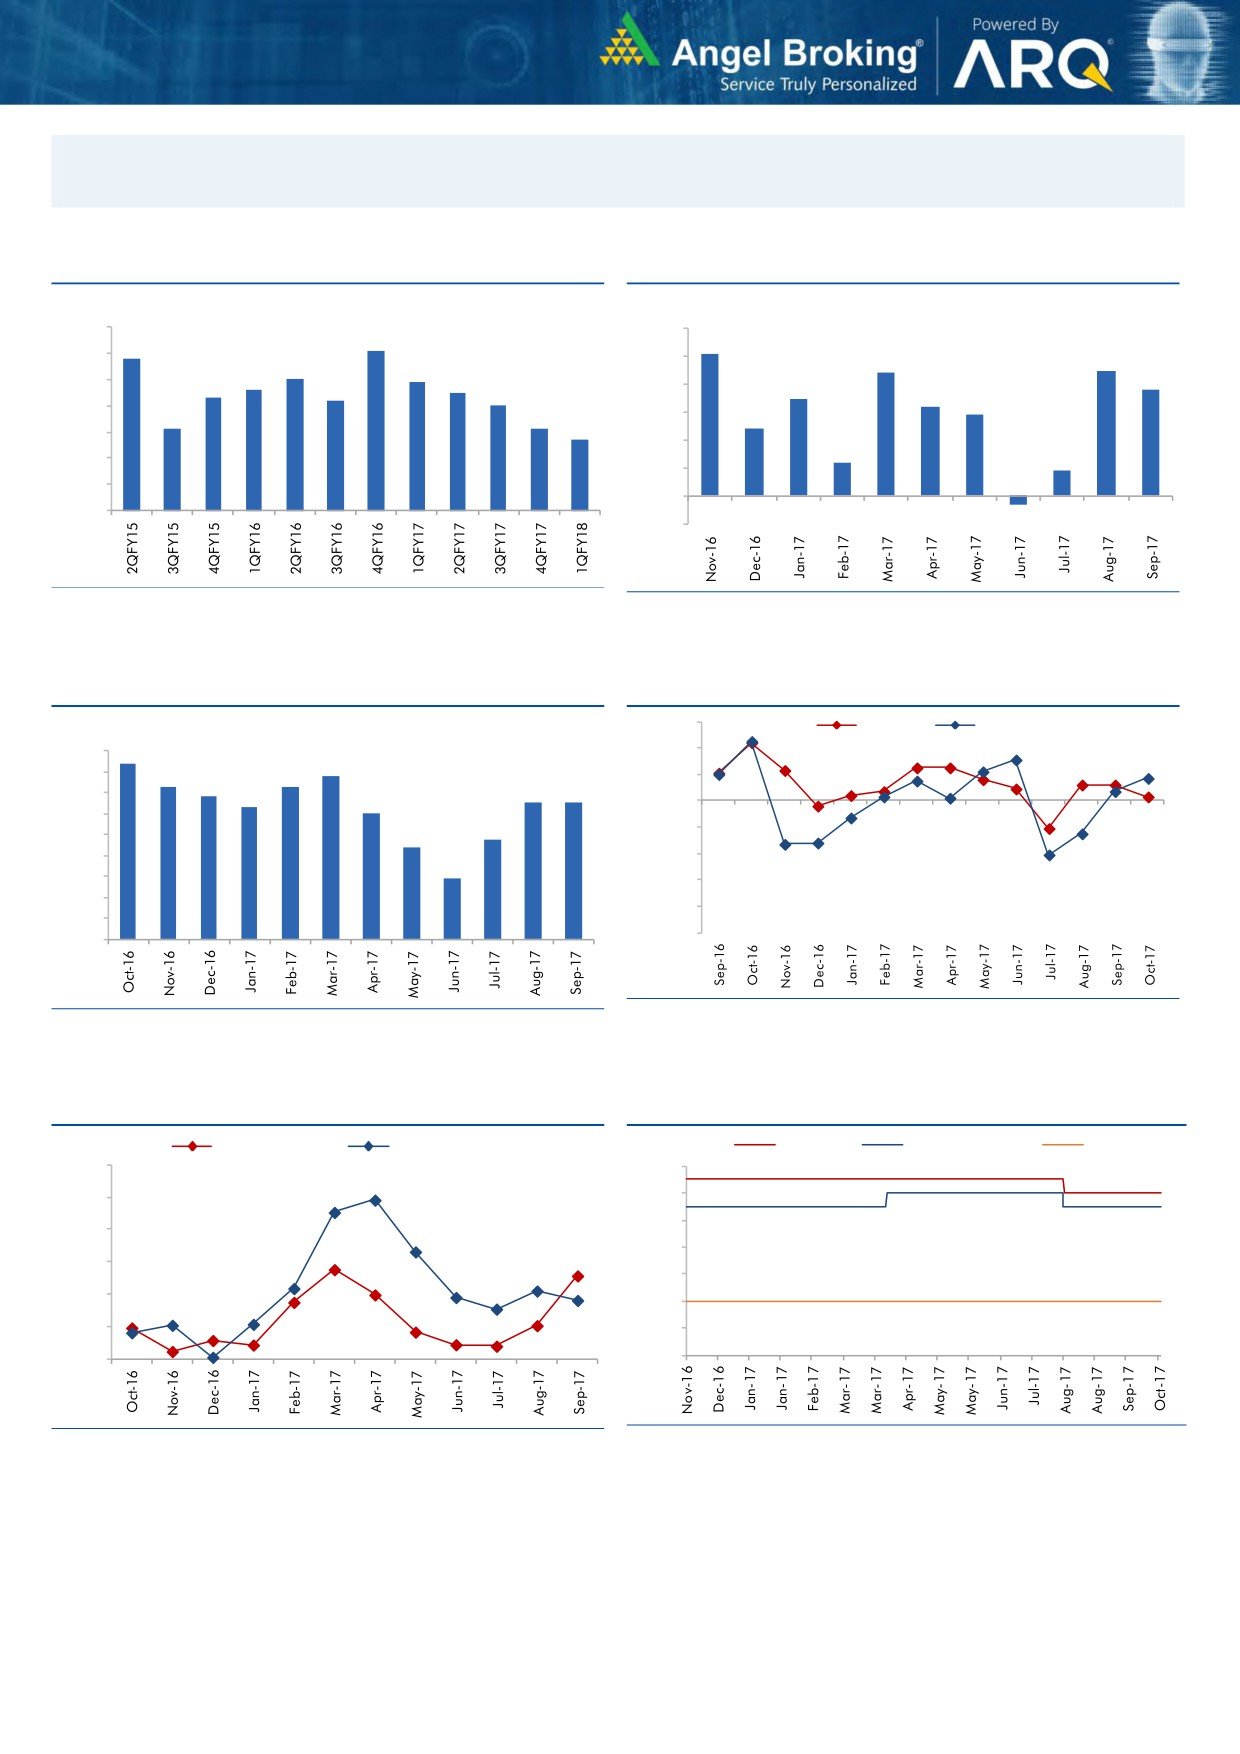
November 14, 2017
Macro watch
Exhibit 1: Quarterly GDP trends
Exhibit 2: IIP trends
(%)
(%)
10.0
6.0
9.1
5.1
8.8
9.0
5.0
4.4
4.5
8.0
7.9
7.6
7.5
3.8
8.0
7.3
7.2
4.0
3.5
7.0
3.2
2.9
7.0
6.1
6.1
3.0
2.4
5.7
6.0
2.0
1.2
5.0
0.9
1.0
4.0
-
3.0
(1.0)
(0.3)
Source: CSO, Angel Research
Source: MOSPI, Angel Research
Exhibit 3: Monthly CPI inflation trends
Exhibit 4: Manufacturing and services PMI
56.0
Mfg. PMI
Services PMI
(%)
4.5
4.2
54.0
3.9
4.0
3.6
3.7
52.0
3.4
3.2
3.3
3.3
3.5
3.0
50.0
3.0
2.4
48.0
2.5
2.2
2.0
46.0
1.5
1.5
44.0
1.0
42.0
0.5
40.0
-
Source: Market, Angel Research; Note: Level above 50 indicates expansion
Source: MOSPI, Angel Research
Exhibit 5: Exports and imports growth trends
Exhibit 6: Key policy rates
(%)
Exports yoy growth
Imports yoy growth
(%)
Repo rate
Reverse Repo rate
CRR
60.0
6.50
50.0
6.00
5.50
40.0
5.00
30.0
4.50
20.0
4.00
10.0
3.50
0.0
3.00
Source: Bloomberg, Angel Research
Source: RBI, Angel Research
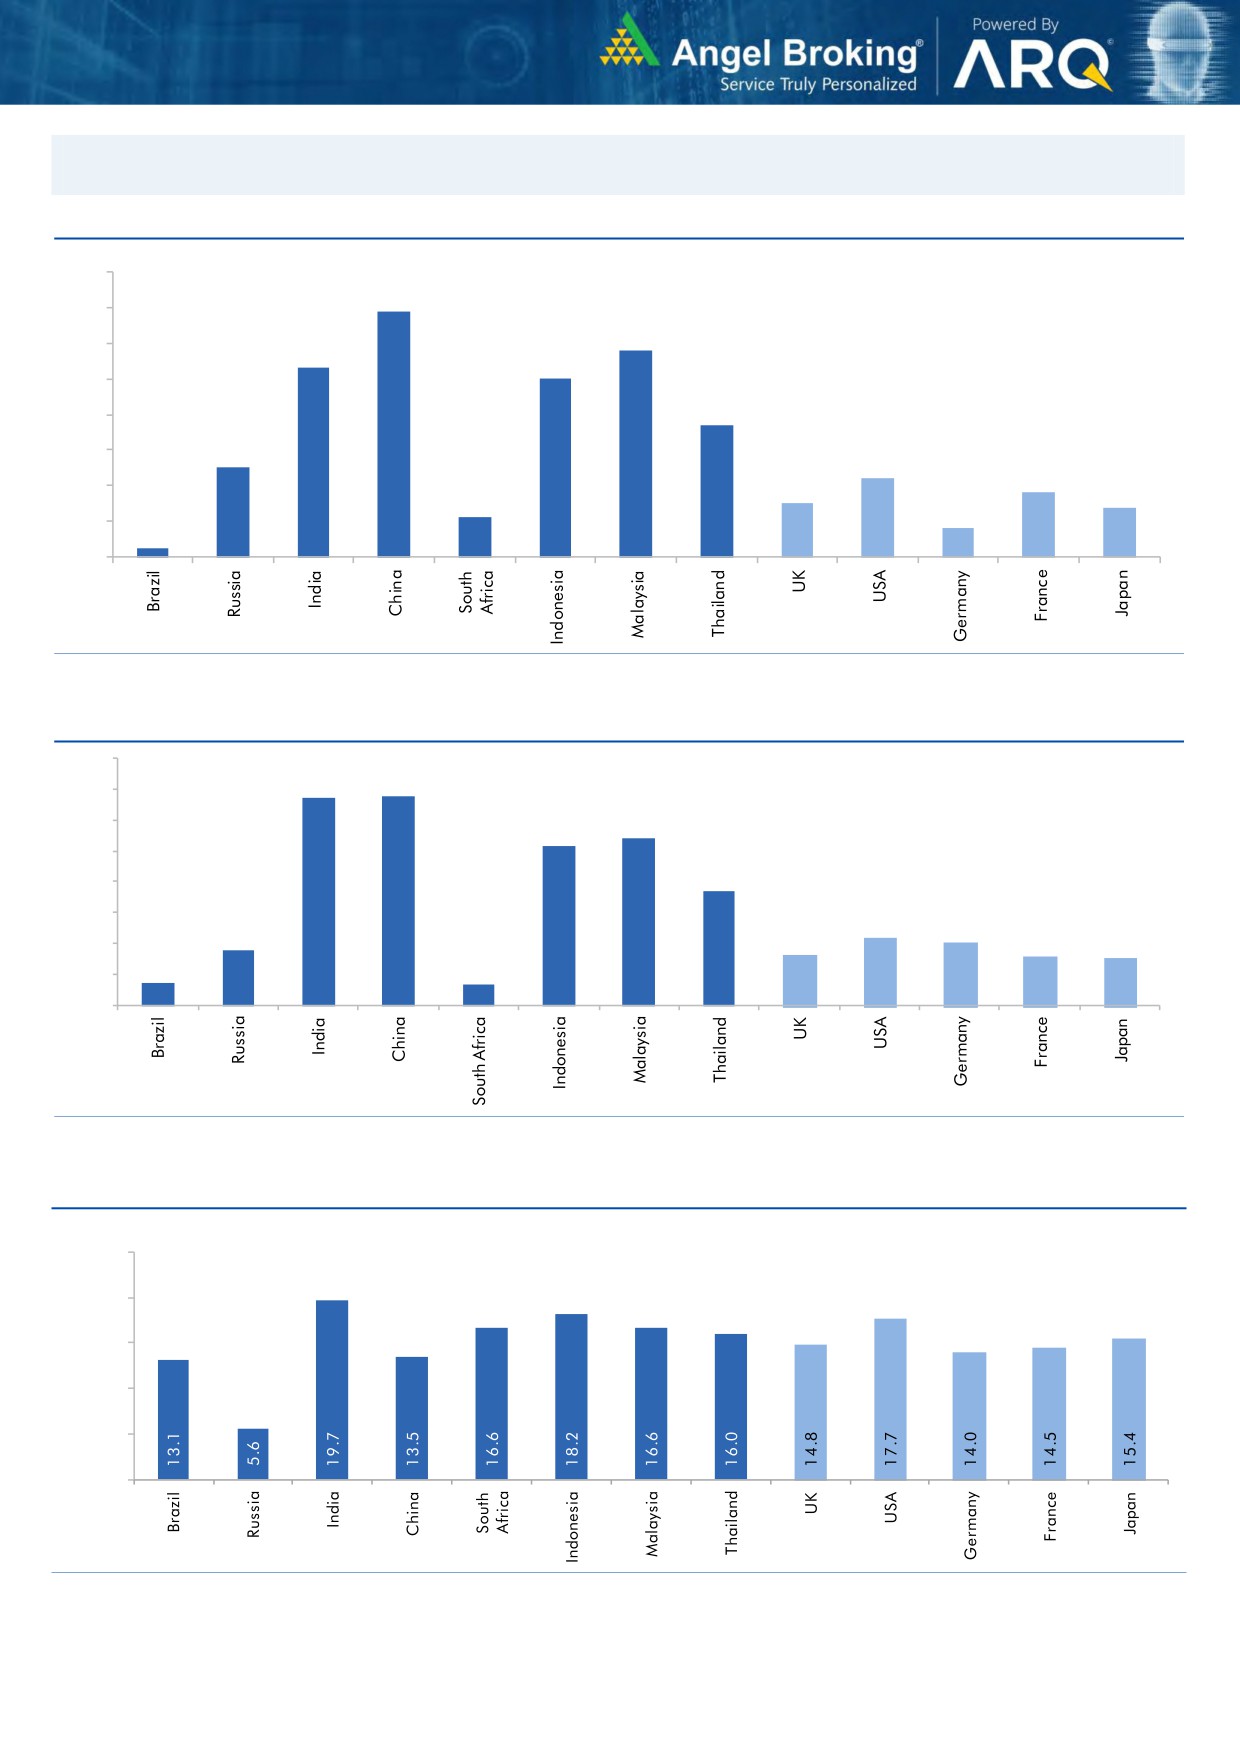
Market Outlook
November 14, 2017
Global watch
Exhibit 1: Latest quarterly GDP Growth (%, yoy) across select developing and developed countries
(%)
8.0
6.9
7.0
5.8
6.0
5.3
5.0
5.0
1.1
3.7
4.0
2.5
3.0
2.2
1.8
2.0
1.5
1.4
0.8
1.0
0.3
-
Source: Bloomberg, Angel Research
Exhibit 2: 2017 GDP Growth projection by IMF (%, yoy) across select developing and developed countries
(%)
6.7
6.8
7.0
6.0
5.4
5.2
5.0
3.7
4.0
3.0
1.8
2.2
2.0
1.7
1.6
2.0
0.7
1.5
0.7
1.0
-
Source: IMF, Angel Research
Exhibit 3: One year forward P-E ratio across select developing and developed countries
(x)
25.0
20.0
15.0
10.0
5.0
-
Source: IMF, Angel Research
Market Outlook
November 14, 2017
Exhibit 4: Relative performance of indices across globe
Returns (%)
Country
Name of index
Closing price
1M
3M
1YR
Brazil
Bovespa
72,475
(5.8)
8.2
14.6
Russia
Micex
2,168
3.2
11.1
7.5
India
Nifty
10,225
2.4
3.2
21.3
China
Shanghai Composite
3,448
1.2
4.8
9.8
South Africa
Top 40
53,531
4.2
9.0
20.3
Mexico
Mexbol
48,002
(4.3)
(6.2)
6.6
Indonesia
LQ45
1,001
1.5
4.8
8.2
Malaysia
KLCI
1,737
(1.1)
(2.5)
5.4
Thailand
SET 50
1,072
(0.7)
7.3
15.0
USA
Dow Jones
23,440
2.6
6.6
24.2
UK
FTSE
7,415
(1.9)
0.8
9.2
Japan
Nikkei
22,381
7.2
13.4
30.3
Germany
DAX
13,074
0.8
8.8
22.6
France
CAC
5,342
(0.4)
3.9
17.9
Source: Bloomberg, Angel Research p68in4
Stock Watch
November 14, 2017
Company Name
Reco
CMP
Target
Mkt Cap
Sales ( Čcr )
OPM(%)
EPS (Č)
PER(x)
P/BV(x)
RoE(%)
EV/Sales(x)
(Č)
Price ( Č)
( Č cr )
FY18E FY19E
FY18E
FY19E
FY18E
FY19E
FY18E
FY19E
FY18E
FY19E
FY18E
FY19E
FY18E
FY19E
Agri / Agri Chemical
Rallis
Reduce
231
209
4,486
1,873
2,099
15.0
15.0
9.5
10.5
24.3
22.0
3.7
3.3
15.8
16.0
2.3
2.1
United Phosphorus
Accumulate
739
820
37,565
18,922
21,949
18.0
18.5
36.2
45.6
20.4
16.2
4.3
3.5
22.7
23.8
2.1
1.8
Auto & Auto Ancillary
Ashok Leyland
Accumulate
113
127
33,149
23,339
27,240
10.1
10.8
4.7
6.2
24.4
18.2
4.9
4.3
20.0
23.6
1.4
1.2
Bajaj Auto
Neutral
3,212
-
92,933
23,936
27,955
19.5
20.1
142.7
167.3
22.5
19.2
4.9
4.4
21.8
22.8
3.5
2.9
Bharat Forge
Buy
689
875
32,098
7,637
8,755
21.7
23.2
36.1
47.3
19.1
14.6
3.4
2.9
18.5
20.8
4.1
3.5
Eicher Motors
Neutral
30,584
-
83,258
19,043
22,837
19.5
19.9
835.4
1,019.0
36.6
30.0
13.7
10.5
40.9
37.8
4.2
3.5
Gabriel India
Neutral
195
-
2,799
1,782
2,033
9.7
10.2
7.1
8.9
27.4
22.0
5.5
4.7
21.0
22.2
1.5
1.3
Hero Motocorp
Buy
3,584
4,129
71,561
32,239
36,878
16.0
15.6
184.4
206.5
19.4
17.4
6.1
5.4
31.3
30.7
2.0
1.7
Jamna Auto Industries Neutral
61
-
2,434
1,441
1,662
14.4
14.8
13.9
17.6
4.4
3.5
1.2
1.0
30.0
31.0
1.7
1.4
Mahindra and Mahindra Neutral
1,411
-
87,639
46,971
53,816
13.6
14.0
67.7
79.8
20.8
17.7
3.0
2.7
15.0
15.9
1.8
1.5
Maruti
Accumulate
8,108
8,890
244,922
80,985
97,917
15.6
16.9
282.3
370.4
28.7
21.9
6.3
5.1
21.8
23.1
2.7
2.1
Minda Industries
Neutral
977
-
8,446
4,328
5,084
11.0
11.9
27.3
36.4
35.9
26.9
7.6
5.9
23.1
25.6
2.0
1.7
Motherson Sumi
Neutral
353
-
74,323
55,937
64,445
10.8
11.4
16.9
21.1
20.9
16.8
4.7
4.8
25.2
25.4
1.4
1.2
Tata Motors
Neutral
418
-
120,749
303,167
343,649
11.8
13.8
33.1
54.7
12.6
7.7
2.1
1.7
16.9
23.0
0.5
0.4
TVS Motor
Neutral
700
-
33,239
13,992
16,216
9.0
9.4
17.1
20.3
41.0
34.5
10.9
8.4
29.7
27.7
2.3
1.9
Amara Raja Batteries
Accumulate
787
858
13,444
6,140
7,122
14.3
15.6
29.3
39.0
26.9
20.2
4.6
3.8
17.1
19.0
2.2
1.9
Exide Industries
Neutral
201
-
17,115
8,689
9,854
15.1
15.2
9.7
11.0
20.9
18.3
3.7
3.3
15.7
16.1
1.7
1.5
Apollo Tyres
Neutral
236
-
13,498
15,739
17,326
13.3
14.6
20.4
26.7
11.6
8.8
1.4
1.2
20.4
26.7
1.1
1.0
Ceat
Neutral
1,748
-
7,069
6,661
7,717
11.1
14.2
116.2
178.2
15.0
9.8
2.6
2.2
15.2
21.3
1.2
1.0
JK Tyres
Neutral
150
-
3,399
8,318
9,239
16.2
16.4
21.0
27.5
7.2
5.5
1.4
1.1
19.1
20.4
0.9
0.7
Swaraj Engines
Neutral
1,908
-
2,370
788
889
16.4
16.5
71.6
81.0
26.7
23.6
7.7
7.1
29.6
31.0
2.7
2.3
Subros
Neutral
247
-
1,479
1,855
2,135
11.6
11.8
10.3
14.7
24.1
16.8
3.7
3.1
15.8
19.1
1.0
0.9
Capital Goods
BEML
Neutral
1,685
-
7,019
4,286
5,194
7.1
8.2
42.9
58.1
39.3
29.0
3.2
2.9
7.6
8.7
1.7
1.4
Bharat Electronics
Neutral
179
-
43,956
10,258
12,470
19.6
19.5
7.3
8.6
24.5
20.8
0.5
0.4
20.4
21.9
3.8
3.1
Voltas
Neutral
576
-
19,066
6,778
8,004
9.6
11.0
17.1
22.4
33.7
25.7
8.0
7.0
17.7
19.8
2.5
2.1
BHEL
Neutral
90
-
32,877
33,200
39,167
6.8
9.5
6.2
11.2
14.4
8.0
0.7
0.6
4.6
8.0
0.6
0.4
Blue Star
Buy
707
867
6,774
5,220
6,207
6.3
6.6
16.8
22.3
42.1
31.7
8.4
7.4
19.9
23.3
1.3
1.0
CG Power and Industrial
Neutral
83
-
5,208
6,555
7,292
7.5
7.5
-
0.8
8,310.0
103.9
1.3
1.3
0.1
1.2
0.9
0.8
Solutions
Greaves Cotton
Neutral
125
-
3,056
1,778
1,993
14.7
15.1
8.1
9.1
15.5
13.8
3.5
3.2
21.8
23.6
1.5
1.3
Stock Watch
November 14, 2017
Company Name
Reco
CMP
Target
Mkt Cap
Sales ( Čcr )
OPM(%)
EPS (Č)
PER(x)
P/BV(x)
RoE(%)
EV/Sales(x)
(Č)
Price ( Č)
( Č cr )
FY18E FY19E
FY18E
FY19E
FY18E
FY19E
FY18E
FY19E
FY18E
FY19E
FY18E
FY19E
FY18E
FY19E
Capital Goods
KEC International
Buy
290
350
7,467
9,779
11,113
9.4
9.8
14.2
18.2
20.5
16.0
3.9
3.2
21.1
22.1
1.0
0.9
KEI Industries
Buy
329
380
2,576
3,001
3,391
10.0
10.0
13.0
16.1
25.3
20.4
4.6
3.8
18.2
18.7
1.0
0.9
Thermax
Neutral
996
-
11,869
4,125
4,747
10.3
10.8
26.7
31.5
37.3
31.6
4.2
3.8
11.2
12.0
2.6
2.3
VATech Wabag
Buy
566
681
3,090
3,867
4,126
9.6
10.0
34.9
39.8
16.2
14.2
2.7
2.3
17.7
17.5
0.8
0.7
Cement
ACC
Neutral
1,754
-
32,937
12,255
13,350
13.5
14.3
58.0
66.2
30.2
26.5
3.6
3.3
11.5
12.2
2.7
2.4
Ambuja Cements
Neutral
271
-
53,761
10,250
11,450
17.5
19.0
7.2
8.3
37.6
32.6
2.7
2.5
7.0
7.8
5.0
4.4
India Cements
Neutral
165
-
5,088
6,135
6,750
14.8
15.2
8.5
11.5
19.4
14.4
1.0
0.9
4.8
6.2
1.2
1.0
JK Cement
Neutral
1,050
-
7,340
4,150
4,775
19.2
20.0
49.0
63.5
21.4
16.5
3.4
2.9
17.0
18.5
2.2
1.9
J K Lakshmi Cement
Neutral
439
-
5,160
3,422
3,757
15.5
17.0
13.5
23.2
32.5
18.9
3.4
2.9
10.8
15.5
1.9
1.7
Orient Cement
Neutral
163
-
3,336
2,215
3,233
16.8
17.0
5.9
6.9
27.6
23.6
2.1
2.0
10.8
10.1
2.5
1.7
UltraTech Cement
Neutral
4,352
-
119,484
28,250
35,150
20.2
23.5
77.5
122.2
56.2
35.6
4.7
4.3
9.6
14.8
4.7
3.8
Construction
KNR Constructions
Neutral
267
-
3,759
1,846
2,203
14.5
14.5
12.1
13.7
22.1
19.6
1.2
1.0
17.5
16.7
2.1
1.7
Larsen & Toubro
Neutral
1,240
-
173,717
95,787
109,476
10.2
11.6
44.5
50.8
27.9
24.4
3.5
3.2
12.9
13.1
2.4
2.1
Gujarat Pipavav Port
Neutral
133
-
6,435
739
842
61.6
62.7
5.1
6.2
26.1
21.6
3.3
3.2
12.7
14.9
8.2
7.0
PNC Infratech
Neutral
179
-
4,581
2,040
2,935
13.0
13.0
6.4
9.0
27.9
19.8
0.7
0.6
9.7
12.2
2.2
1.6
Simplex Infra
Neutral
518
-
2,563
6,012
6,619
11.6
11.7
21.1
31.0
24.6
16.7
1.7
1.6
6.5
8.6
1.0
0.9
Sadbhav Engineering
Neutral
316
-
5,429
3,823
4,426
10.7
10.8
10.3
11.8
30.7
26.8
3.7
3.2
10.1
10.5
1.7
1.5
NBCC
Neutral
269
-
24,197
9,099
12,706
6.4
6.4
7.3
9.6
36.9
28.1
1.6
1.3
27.5
30.5
2.5
1.8
MEP Infra
Neutral
104
-
1,692
2,403
2,910
18.3
16.8
2.4
6.1
44.2
17.1
16.8
11.3
35.2
55.8
1.9
1.5
SIPL
Neutral
115
-
4,047
2,060
2,390
46.8
47.7
(5.8)
(3.1)
4.3
4.9
(14.2)
(2.3)
6.7
6.3
Engineers India
Neutral
186
-
12,514
1,795
2,611
21.1
22.4
5.9
8.1
31.5
22.9
2.3
2.2
12.9
16.1
5.4
3.5
Financials
Axis Bank
Accumulate
538
580
128,968
32,558
35,843
3.5
3.2
27.8
41.0
19.3
13.1
2.1
1.8
11.4
14.9
-
-
Bank of Baroda
Neutral
172
-
39,585
22,533
26,079
2.4
2.4
12.0
20.9
14.3
8.2
0.9
0.9
6.6
11.0
-
-
Canara Bank
Neutral
383
-
22,900
17,925
20,235
2.0
2.1
18.5
36.5
20.7
10.5
0.8
0.7
3.4
6.2
-
-
Can Fin Homes
Neutral
453
-
6,030
586
741
3.5
3.5
107.8
141.0
4.2
3.2
0.9
0.7
24.1
25.6
-
-
Cholamandalam Inv. &
Neutral
1,247
-
19,488
2,826
3,307
6.3
6.3
53.7
64.6
23.2
19.3
4.0
3.4
18.3
18.9
-
-
Fin. Co.
Dewan Housing Finance Accumulate
633
712
19,858
2,676
3,383
2.4
2.7
37.4
49.7
16.9
12.7
2.2
1.9
13.8
16.2
-
-
Equitas Holdings
Buy
140
235
4,753
1,125
1,380
9.6
9.8
1.5
6.0
93.3
23.3
2.1
2.0
2.4
8.2
-
-
Federal Bank
Accumulate
115
125
22,407
4,896
5,930
2.8
3.1
5.4
7.6
21.3
15.1
1.8
1.7
8.5
11.0
-
-
Stock Watch
November 14, 2017
Company Name
Reco
CMP
Target
Mkt Cap
Sales ( Čcr )
OPM(%)
EPS (Č)
PER(x)
P/BV(x)
RoE(%)
EV/Sales(x)
(Č)
Price ( Č)
( Č cr )
FY18E FY19E
FY18E
FY19E
FY18E
FY19E
FY18E
FY19E
FY18E
FY19E
FY18E
FY19E
FY18E
FY19E
Financials
GIC Housing
Buy
428
655
2,303
376
477
3.6
3.7
33.0
40.0
13.0
10.7
2.3
2.0
20.0
23.0
-
-
HDFC Bank
Neutral
1,814
-
469,175
55,236
63,253
4.5
4.4
68.9
82.4
26.4
22.0
4.6
3.8
18.7
18.5
-
-
ICICI Bank
Neutral
314
-
201,633
42,361
51,378
3.6
3.9
18.4
25.7
17.1
12.2
1.9
1.8
11.3
15.0
-
-
Karur Vysya Bank
Buy
129
180
7,805
3,289
3,630
3.7
3.9
10.8
14.1
11.9
9.2
1.4
1.3
12.5
14.7
-
-
LIC Housing Finance
Accumulate
584
630
29,490
4,895
6,332
3.4
3.7
50.7
66.8
11.5
8.8
2.3
1.9
21.7
23.8
-
-
Punjab Natl.Bank
Neutral
187
-
39,878
23,708
25,758
2.1
2.1
5.9
16.4
31.9
11.4
0.9
0.9
3.0
8.3
-
-
RBL Bank
Neutral
510
-
21,227
2,309
2,888
2.6
2.5
16.4
19.1
31.2
26.8
3.9
3.5
13.3
13.8
-
-
Repco Home Finance
Buy
592
825
3,706
496
597
4.4
4.2
38.5
48.7
15.4
12.2
2.8
2.3
19.6
20.6
-
-
South Ind.Bank
Neutral
31
-
5,512
3,195
3,567
3.0
3.1
3.0
3.8
10.1
8.0
1.0
0.9
10.5
11.9
-
-
St Bk of India
Neutral
331
-
285,894
105,827
121,056
2.4
2.5
16.1
25.6
20.6
13.0
1.6
1.5
6.6
9.9
-
-
Union Bank
Neutral
168
-
12,208
14,650
16,225
2.3
2.3
23.1
32.5
7.3
5.2
0.6
0.5
7.1
9.2
-
-
Yes Bank
Neutral
304
-
69,569
11,088
13,138
3.0
2.9
84.0
99.3
3.6
3.1
0.6
0.5
16.3
16.8
-
-
FMCG
Akzo Nobel India
Neutral
1,794
-
8,604
3,164
3,607
13.8
13.7
58.6
67.9
30.6
26.4
7.5
6.6
24.5
25.1
2.6
2.2
Asian Paints
Neutral
1,175
-
112,715
17,603
20,615
18.6
18.6
2,128.9
2,543.3
0.6
0.5
11.6
9.8
28.0
28.9
6.2
5.2
Britannia
Neutral
4,883
-
58,625
9,690
11,278
14.8
15.4
84.0
101.0
58.1
48.4
21.2
16.8
40.6
39.0
6.0
5.2
Colgate
Neutral
1,048
-
28,499
4,420
5,074
24.9
25.3
28.6
32.8
36.6
32.0
14.5
11.7
43.8
40.5
6.2
5.4
Dabur India
Neutral
337
-
59,372
8,346
9,344
19.6
19.9
7.8
9.0
43.2
37.5
8.7
7.9
25.2
24.8
6.7
5.9
GlaxoSmith Con*
Neutral
6,031
-
25,363
5,072
5,760
18.2
18.4
176.3
199.2
34.2
30.3
7.3
6.6
21.2
21.7
4.3
3.8
Godrej Consumer
Neutral
935
-
63,732
10,171
11,682
20.8
21.5
21.7
27.1
43.1
34.5
9.7
8.3
22.3
23.4
6.4
5.5
HUL
Neutral
1,279
-
276,761
37,077
41,508
20.3
21.8
5,189.9
6,318.5
0.3
0.2
39.0
33.3
74.8
82.0
7.3
6.5
ITC
Neutral
258
-
314,813
44,588
49,853
37.0
37.3
9.6
11.0
26.9
23.5
6.6
6.3
25.1
27.3
6.5
5.8
Marico
Neutral
308
-
39,775
6,788
7,766
18.5
19.2
7.1
8.5
43.4
36.3
15.2
13.0
36.9
38.0
5.7
5.0
Nestle*
Neutral
7,715
-
74,381
10,083
11,182
20.0
20.9
119.7
141.3
64.5
54.6
227.1
207.6
36.7
39.8
7.1
6.3
Tata Global
Neutral
234
-
14,794
7,121
7,641
11.9
12.3
6.9
8.0
34.0
29.3
2.3
2.2
6.8
7.2
1.9
1.7
Procter & Gamble
Neutral
8,730
-
28,338
3,034
3,579
27.1
27.7
167.7
198.8
52.1
43.9
14.0
12.0
28.8
29.5
8.8
7.3
Hygiene
IT
HCL Tech^
Buy
869
1,014
124,069
50,009
54,608
22.1
22.1
62.8
67.6
13.8
12.9
3.1
2.7
22.4
20.6
2.1
1.8
Infosys
Buy
952
1,120
218,628
70,333
75,960
26.0
26.0
61.7
65.9
15.4
14.4
2.9
2.7
18.9
18.7
2.5
2.3
TCS
Neutral
2,759
-
528,133
123,384
134,488
26.1
26.1
133.2
143.7
20.7
19.2
5.7
5.3
27.6
27.8
3.9
3.6
Tech Mahindra
Accumulate
492
533
48,004
31,015
33,496
15.0
15.0
35.6
38.1
13.8
12.9
2.4
2.2
17.0
16.3
1.3
1.2
Stock Watch
November 14, 2017
Company Name
Reco
CMP
Target
Mkt Cap
Sales ( Čcr )
OPM(%)
EPS (Č)
PER(x)
P/BV(x)
RoE(%)
EV/Sales(x)
(Č)
Price ( Č)
( Č cr )
FY18E FY19E
FY18E
FY19E
FY18E
FY19E
FY18E
FY19E
FY18E
FY19E
FY18E
FY19E
FY18E
FY19E
IT
Wipro
Neutral
299
-
145,417
54,164
56,544
22.3
22.3
18.8
19.5
15.9
15.3
2.5
2.2
15.0
13.6
1.9
1.7
Media
D B Corp
Neutral
367
-
6,757
2,404
2,625
30.5
31.5
23.7
26.9
15.5
13.7
3.6
3.1
23.5
22.8
2.7
2.4
HT Media
Neutral
97
-
2,268
2,589
2,830
15.1
15.4
8.3
10.9
11.7
8.9
1.0
0.9
8.4
10.4
0.4
0.3
Jagran Prakashan
Buy
169
225
5,525
2,541
2,835
28.5
28.7
12.7
14.1
13.3
12.0
2.8
2.4
21.3
21.4
2.0
1.7
Sun TV Network
Neutral
857
-
33,753
3,238
3,789
51.9
55.1
30.9
38.0
27.7
22.5
7.9
6.9
30.0
31.0
9.9
8.4
Hindustan Media
Neutral
240
-
1,761
1,002
1,074
23.3
23.5
29.2
33.8
8.2
7.1
1.3
1.1
15.6
15.4
0.8
0.5
Ventures
TV Today Network
Buy
373
435
2,226
667
727
27.7
27.7
18.6
20.1
20.1
18.6
3.1
3.2
15.6
17.3
2.9
2.7
Music Broadcast Limited Accumulate
384
434
2,193
271
317
91.0
109.0
6.0
10.0
64.1
38.4
4.0
3.6
6.5
9.3
7.7
6.3
Metals & Mining
Coal India
Neutral
276
-
171,387
82,301
91,235
17.0
18.0
17.1
20.5
16.2
13.5
3.0
2.9
45.0
55.0
1.8
1.6
Hind. Zinc
Neutral
311
-
131,196
22,108
24,555
57.0
58.0
22.1
26.3
14.1
11.8
4.6
3.7
32.0
35.0
4.9
4.1
Hindalco
Neutral
261
-
58,543
102,350
105,355
13.5
14.5
21.5
24.5
12.1
10.7
1.7
1.4
15.0
15.2
1.1
1.1
JSW Steel
Neutral
264
-
63,863
64,500
68,245
21.1
21.5
20.1
21.2
13.1
12.5
2.4
2.1
-
-
1.7
1.6
NMDC
Neutral
126
-
39,881
10,209
11,450
47.0
48.0
11.1
12.1
11.4
10.4
1.6
1.5
-
-
3.4
3.1
SAIL
Neutral
79
-
32,586
54,100
63,555
3.0
10.0
(10.0)
1.5
52.6
1.1
1.0
-
-
1.6
1.4
Vedanta
Neutral
315
-
116,980
81,206
87,345
28.0
29.0
26.5
33.5
11.9
9.4
2.7
2.3
-
-
2.2
1.9
Tata Steel
Neutral
691
-
67,096
121,445
126,500
16.2
17.2
65.4
81.3
10.6
8.5
1.7
1.4
-
-
1.1
0.9
Oil & Gas
GAIL
Neutral
455
-
76,997
53,115
52,344
14.2
15.3
30.0
31.1
15.2
14.6
1.9
1.7
-
-
1.2
1.2
ONGC
Neutral
184
-
236,517
83,111
84,934
44.2
44.9
16.4
16.9
11.2
10.9
1.4
1.3
-
-
2.7
2.7
Indian Oil Corp
Neutral
397
-
192,634
396,116
432,560
8.5
8.8
40.1
42.2
9.9
9.4
1.7
1.5
-
-
0.6
0.6
Reliance Industries
Neutral
875
-
569,180
257,711
267,438
17.0
18.2
89.1
89.5
9.8
9.8
0.9
0.9
-
-
1.9
1.8
Pharmaceuticals
Alembic Pharma
Buy
514
600
9,687
3,903
4,584
18.2
19.2
21.8
27.2
23.6
18.9
4.3
3.6
19.8
20.6
2.5
2.1
Alkem Laboratories Ltd
Accumulate
1,991
2,125
23,809
6,320
7,341
17.5
19.8
72.7
96.6
27.4
20.6
4.8
4.1
16.7
18.7
3.7
3.1
Aurobindo Pharma
Buy
712
823
41,727
17,086
19,478
22.1
22.0
44.7
51.4
15.9
13.9
3.5
2.9
24.7
22.7
2.6
2.2
Aventis*
Neutral
4,478
-
10,313
2,508
2,862
16.8
16.8
139.9
153.8
32.0
29.1
4.6
3.8
23.5
25.8
3.7
3.1
Cadila Healthcare
Reduce
451
426
46,145
11,584
13,228
20.3
20.4
18.7
21.3
24.1
21.2
5.4
4.4
24.6
22.9
3.8
3.3
Cipla
Sell
602
458
48,455
16,619
19,437
15.4
16.2
19.7
24.3
30.6
24.8
3.5
3.1
12.0
13.2
3.1
2.6
Dr Reddy's
Neutral
2,344
-
38,871
15,844
17,973
17.6
18.2
91.7
111.0
25.6
21.1
2.9
2.6
11.9
13.0
2.7
2.4
GSK Pharma*
Neutral
2,629
-
22,272
3,260
3,651
15.0
18.0
46.1
58.6
57.0
44.9
11.7
12.1
20.0
26.5
6.7
6.1
Indoco Remedies
Sell
255
153
2,353
1,154
1,310
14.9
14.9
11.3
12.7
22.6
20.1
3.2
2.8
15.0
15.0
2.2
1.8
Stock Watch
November 14, 2017
Company Name
Reco
CMP
Target
Mkt Cap
Sales ( Čcr )
OPM(%)
EPS (Č)
PER(x)
P/BV(x)
RoE(%)
EV/Sales(x)
(Č)
Price ( Č)
( Č cr )
FY18E FY19E
FY18E
FY19E
FY18E
FY19E
FY18E
FY19E
FY18E
FY19E
FY18E
FY19E
FY18E
FY19E
Pharmaceuticals
Ipca labs
Neutral
544
-
6,863
3,593
4,022
14.5
15.5
19.4
25.2
28.0
21.6
2.6
2.3
9.5
11.2
2.0
1.8
Lupin
Buy
829
1,467
37,443
18,657
21,289
21.3
23.3
52.8
66.7
15.7
12.4
2.4
2.0
16.3
17.5
2.0
1.7
Natco Pharma
Accumulate
934
1,057
16,288
1,886
2,016
32.3
29.5
23.2
22.0
40.3
42.4
8.4
7.5
20.9
17.6
8.5
7.9
Sun Pharma
Neutral
533
-
127,760
32,899
36,451
26.9
25.4
31.6
32.3
16.9
16.5
3.0
2.6
18.7
18.8
3.5
3.0
Syngene International
Accumulate
496
556
9,920
1,394
1,818
33.0
36.0
15.8
20.6
31.4
24.1
5.8
4.8
18.6
20.0
7.1
5.4
Power
Tata Power
Neutral
82
-
22,179
32,547
33,806
20.5
20.5
4.7
5.4
17.5
15.3
1.7
1.4
10.5
10.5
1.7
1.6
NTPC
Neutral
177
-
145,903
86,070
101,246
28.3
30.7
12.9
16.2
13.7
10.9
1.4
1.3
10.6
12.4
3.1
2.7
Power Grid
Accumulate
211
223
110,596
29,183
32,946
89.7
90.0
18.0
20.8
11.8
10.2
2.0
1.8
17.7
18.2
7.7
7.2
Real Estate
Prestige Estate
Neutral
290
-
10,864
4,607
5,146
21.0
22.2
7.9
9.8
36.7
29.6
2.3
2.1
10.3
12.0
3.5
3.2
MLIFE
Buy
436
522
2,237
487
590
12.3
17.8
21.0
31.2
20.8
14.0
1.1
1.0
5.2
7.4
3.3
2.7
Telecom
Bharti Airtel
Neutral
498
-
199,091
97,903
105,233
36.0
36.3
9.3
11.1
53.6
45.1
2.6
2.4
5.0
5.6
3.0
2.7
Idea Cellular
Neutral
94
-
33,746
35,012
37,689
27.1
27.7
(4.4)
(2.7)
1.5
1.5
(6.8)
(4.6)
2.3
2.0
zOthers
Abbott India
Neutral
5,056
-
10,744
3,244
3,723
14.9
16.1
167.5
209.4
30.2
24.2
6.7
5.6
23.7
24.8
3.0
2.5
Asian Granito
Buy
485
570
1,460
1,169
1,286
12.5
12.5
16.0
19.7
30.4
24.6
3.2
2.9
10.7
11.6
1.5
1.3
Bajaj Electricals
Neutral
404
-
4,111
4,646
5,301
6.7
7.6
16.1
22.3
25.1
18.1
4.1
3.5
16.4
19.2
0.9
0.8
Banco Products (India)
Neutral
216
-
1,546
1,530
1,695
13.2
12.7
19.0
20.0
11.4
10.8
1.8
1.6
0.2
0.2
0.9
102.2
Coffee Day Enterprises
Neutral
228
-
4,695
3,494
3,913
17.4
18.0
4.8
5.7
-
40.0
2.0
1.9
-
0.1
1.8
1.6
Ltd
Elecon Engineering
Neutral
69
-
778
171
201
15.0
16.2
36.0
43.0
1.9
1.6
0.2
0.2
0.1
0.1
3.9
3.3
Garware Wall Ropes
Neutral
900
-
1,970
928
1,003
15.2
15.2
39.4
43.2
22.8
20.9
3.8
3.2
16.5
15.4
2.0
1.8
Goodyear India*
Neutral
797
-
1,839
1,717
1,866
11.8
12.3
47.9
49.8
16.6
16.0
2.6
2.2
15.6
15.7
0.8
109.7
Hitachi
Neutral
2,473
-
6,724
2,355
2,715
10.3
10.8
49.0
60.9
50.5
40.6
11.8
9.3
0.2
0.2
2.9
2.5
HSIL
Neutral
465
-
3,363
2,240
2,670
14.6
15.0
17.0
22.0
27.4
21.2
2.3
2.1
0.1
0.1
1.7
1.4
Interglobe Aviation
Neutral
1,175
-
45,109
22,570
27,955
14.2
15.0
63.6
81.8
18.5
14.4
9.7
8.2
0.5
0.6
1.7
1.3
Jyothy Laboratories
Neutral
343
-
6,233
1,781
2,044
14.1
15.0
9.4
10.5
36.7
32.7
7.8
7.3
0.2
0.2
3.7
3.2
Linc Pen & Plastics
Neutral
248
-
367
420
462
9.3
9.3
15.3
17.1
16.2
14.5
2.7
2.8
16.9
19.5
0.9
0.8
M M Forgings
Neutral
837
-
1,010
542
642
20.1
21.0
41.6
56.8
20.1
14.7
2.8
2.3
0.1
0.2
2.3
2.0
Mirza International
Neutral
159
-
1,917
1,148
1,285
18.0
18.0
8.0
9.4
19.8
17.0
3.3
2.8
16.3
16.1
1.8
1.6
Navkar Corporation
Buy
188
265
2,828
561
617
41.5
41.5
11.5
12.7
16.3
14.8
1.7
1.5
10.5
10.4
5.7
5.0
Nilkamal
Neutral
1,583
-
2,363
2,317
2,525
11.4
11.1
96.0
105.0
16.5
15.1
2.8
2.4
0.2
0.2
1.0
0.9
Stock Watch
November 14, 2017
Company Name
Reco
CMP
Target Mkt Cap
Sales ( Čcr )
OPM(%)
EPS (Č)
PER(x)
P/BV(x)
RoE(%)
EV/Sales(x)
(Č)
Price ( Č)
( Č cr )
FY18E FY19E FY18E FY19E FY18E FY19E FY18E FY19E FY18E FY19E FY18E FY19E FY18E FY19E
zOthers
Parag Milk Foods
Neutral
244
-
2,049
1,987
2,379
7.6
9.0
12.4
18.3
19.6
13.3
2.8
2.4
8.2
13.2
1.1
1.0
Radico Khaitan
Neutral
215
-
2,869
1,811
1,992
13.2
13.2
8.1
8.8
26.6
24.5
2.7
2.9
10.1
12.0
1.9
1.7
Relaxo Footwears
Neutral
561
-
6,739
1,981
2,310
13.7
14.5
12.0
15.5
46.8
36.2
9.1
7.4
0.2
0.2
3.5
3.0
Siyaram Silk Mills
Accumulate
589
650
2,761
1,769
1,981
12.7
12.7
22.6
26.2
26.0
22.5
4.0
3.5
15.5
15.5
1.7
1.5
Styrolution ABS India* Neutral
942
-
1,656
1,800
1,980
8.0
8.1
42.0
46.2
22.4
20.4
2.5
2.2
0.1
0.1
1.0
1.0
Surya Roshni
Neutral
360
-
1,579
4,870
5,320
7.7
7.8
22.8
28.1
15.8
12.8
2.1
1.8
0.1
0.1
0.5
0.5
TVS Srichakra
Neutral
3,132
-
2,398
2,729
2,893
12.7
12.5
248.5
265.0
12.6
11.8
3.6
2.9
0.3
0.3
0.9
0.8
Visaka Industries
Neutral
663
-
1,053
1,104
1,214
12.1
12.6
31.0
37.9
21.4
17.5
2.6
2.3
0.1
0.1
1.2
1.1
VIP Industries
Neutral
314
-
4,439
1,450
1,693
10.4
10.5
6.5
7.8
48.0
40.2
10.2
8.9
21.1
22.1
3.1
2.6
Navin Fluorine
Accumulate
687
730
3,385
945
1,154
22.4
22.6
28.7
34.8
23.9
19.8
4.0
3.4
-
-
3.1
2.4
Source: Company, Angel Research; Note: *December year end; #September year end; &October year end; Price as on November 13, 2017
Market Outlook
November 14, 2017
Research Team Tel: 022 - 39357800
DISCLAIMER
Angel Broking Private Limited (hereinafter referred to as “Angel”) is a registered Member of National Stock Exchange of India
Limited,Bombay Stock Exchange Limited and Metropolitan Stock Exchange Limited. It is also registered as a Depository Participant with
CDSL and Portfolio Manager with SEBI. It also has registration with AMFI as a Mutual Fund Distributor. Angel Broking Private Limited is a
registered entity with SEBI for Research Analyst in terms of SEBI (Research Analyst) Regulations, 2014 vide registration number
INH000000164. Angel or its associates has not been debarred/ suspended by SEBI or any other regulatory authority for accessing
/dealing in securities Market. Angel or its associates/analyst has not received any compensation / managed or
co-managed public offering of securities of the company covered by Analyst during the past twelve months.
This document is solely for the personal information of the recipient, and must not be singularly used as the basis of any investment
decision. Nothing in this document should be construed as investment or financial advice. Each recipient of this document should make
such investigations as they deem necessary to arrive at an independent evaluation of an investment in the securities of the companies
referred to in this document (including the merits and risks involved), and should consult their own advisors to determine the merits and
risks of such an investment.
Reports based on technical and derivative analysis center on studying charts of a stock's price movement, outstanding positions and
trading volume, as opposed to focusing on a company's fundamentals and, as such, may not match with a report on a company's
fundamentals. Investors are advised to refer the Fundamental and Technical Research Reports available on our website to evaluate the
contrary view, if any.
The information in this document has been printed on the basis of publicly available information, internal data and other reliable
sources believed to be true, but we do not represent that it is accurate or complete and it should not be relied on as such, as this
document is for general guidance only. Angel Broking Pvt. Limited or any of its affiliates/ group companies shall not be in any way
responsible for any loss or damage that may arise to any person from any inadvertent error in the information contained in this report.
Angel Broking Pvt. Limited has not independently verified all the information contained within this document. Accordingly, we cannot
testify, nor make any representation or warranty, express or implied, to the accuracy, contents or data contained within this document.
While Angel Broking Pvt. Limited endeavors to update on a reasonable basis the information discussed in this material, there may be
regulatory, compliance, or other reasons that prevent us from doing so.
This document is being supplied to you solely for your information, and its contents, information or data may not be reproduced,
redistributed or passed on, directly or indirectly.
Neither Angel Broking Pvt. Limited, nor its directors, employees or affiliates shall be liable for any loss or damage that may arise from
or in connection with the use of this information.